How to deeply instrument a Spark Cluster with OpenTelemetry (feat. real time Power BI report)
I've been using Spark since 2017, and Spark Plugins are hands down THE most flexible programmatic interface that I only very recently learnt about.
I went down this rabbit hole while looking into a "memory leak" in one of our heavy-duty production jobs that's been plaguing me for weeks in a JOIN-heavy job:

The problem with the Spark Web UI above is, it doesn't give you a time-series view of the memory usage of each of the nodes and granular time-series metrics. You only find out when a stage-crashed, but not why. Spark logs don't really help, all you see before the executor death is MemoryManager.scala frantically spilling to disk, until the OS gets OOMKILLED by your Cloud Provider's Cluster Manager.
This means you need some sort of a profiling mechanism that lets you see exactly what's happening at the OS of each nodes in the cluster that's causing the agonizing death of your ETL pipelines.
The Rolls-Royce of observability is OpenTelemetry, so I wanted to figure out how to instrument all nodes in Spark with it, just like I'd instrument any C#/Go/Java application. Since Spark is just a big old Scala application, it should be possible.
Architecture
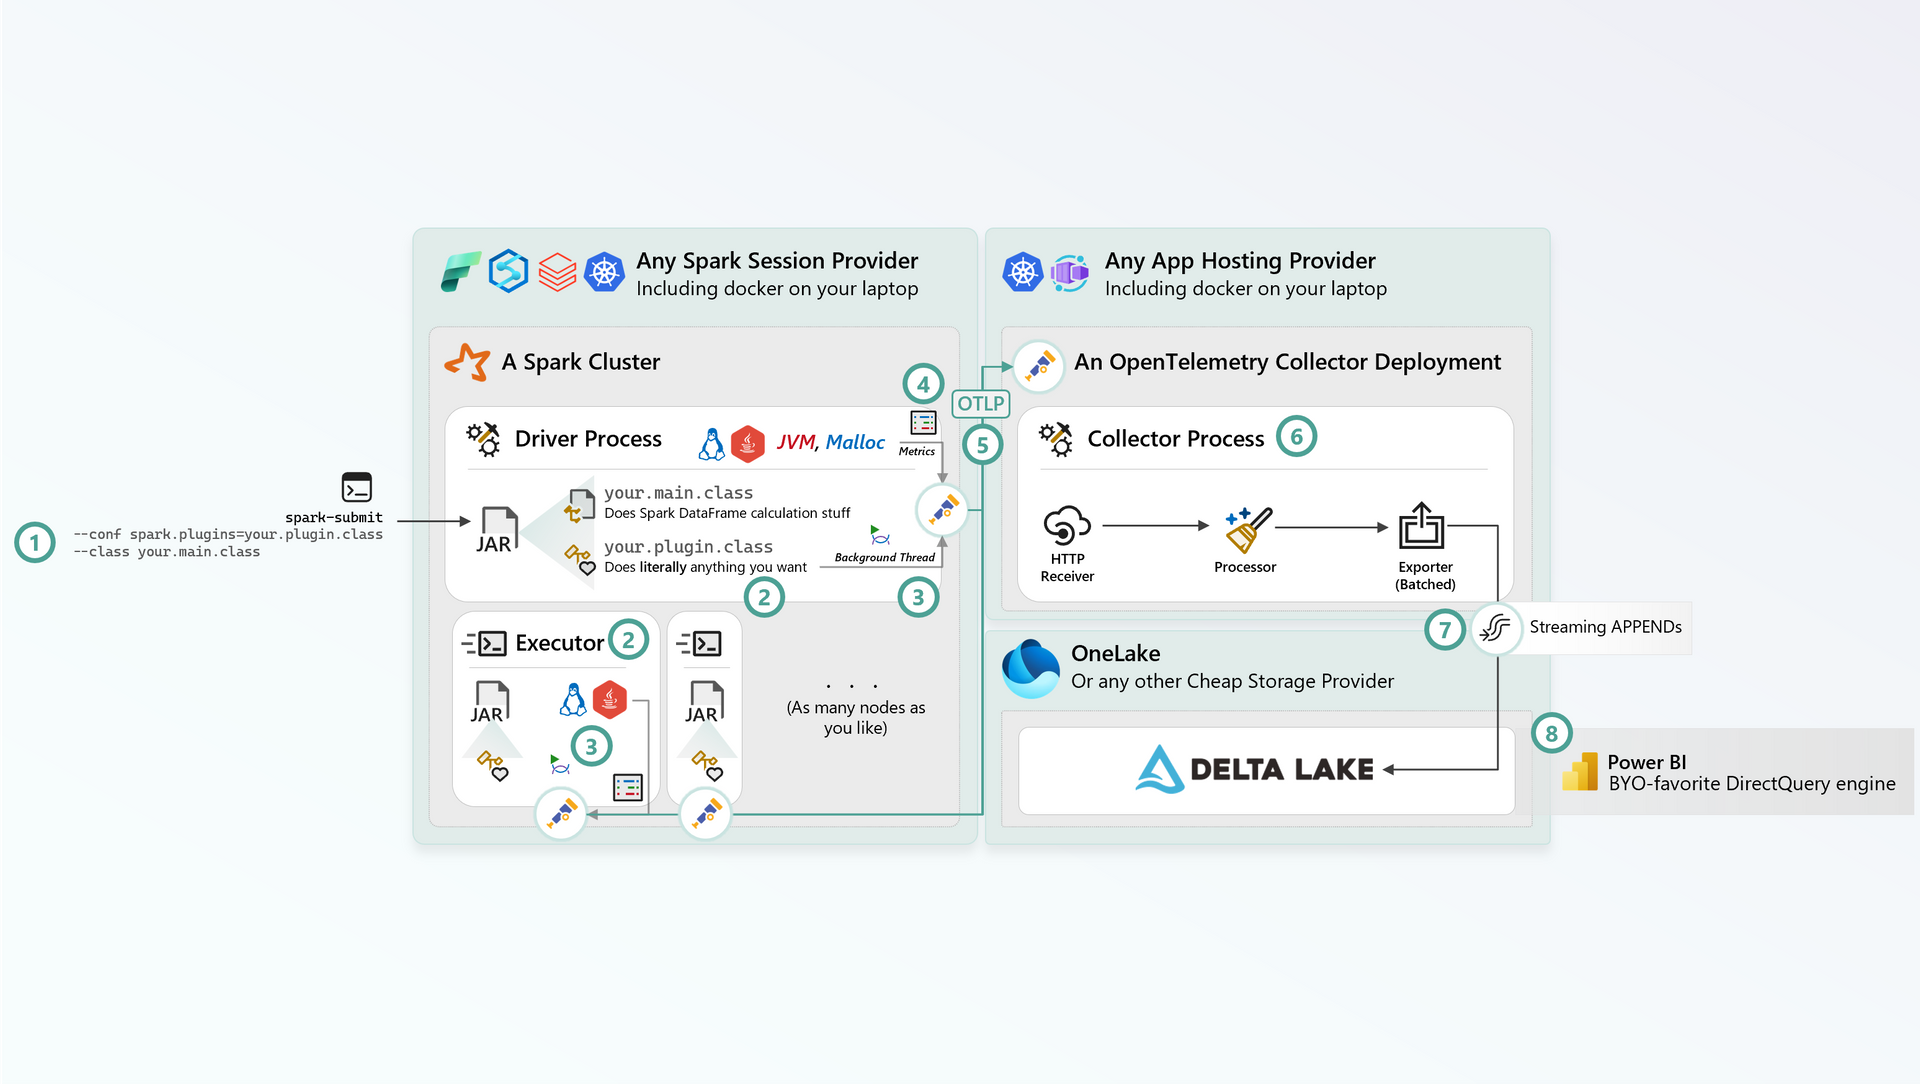
Use
spark.plugins=your.plugin.classconfig to pass a class you wrote that implements the SparkPlugin.javainterface. For example, Spark Connect is a plugin, here's how it's initialized. You can initialize the same class on both the Driver and the Executors.your.plugin.classwill get a callback on theinitmethod onDriverPluginandExecutorPlugin. You will also have access to the Spark Conf viaPluginContext.conf().So that means, at this point, if you spinup a background daemon thread before you leave
init, you can literally do whatever you want from now onwards 😁 - things like making outbound HTTP calls, probing memory, hosting a silly REST API or anything else - you have access to everything in Spark Conf Key:Value pairs, meaning you can authenticate with Azure resources etc with Entra ID.Spin up a background daemon thread that probes various sources of memory from the JVM, Spark, Linux Operating System, and more.
Have the thread receive the
Metricsinto a nice giant class to send as a single time-series data point.Send those
Metricsas an OpenTelemetry Metric to an HTTP endpoint where you have your OpenTelemetry Collector hosted (it could be locally on your laptop, or a Kubernetes Cluster for Production).Use the OpenTelemetry Collector to do "collector things" - like pre-processing, enriching, obfuscating etc.
Use an OpenTelemetry Exporter to export to Delta Lake (there's nothing out there for Delta, but building your own Exporter is trivial - and you can use this Go SDK for Delta Lake).
Throw Power BI on top of the ever-growing Delta Lake tables, potentially using Fabric SQL, Eventhouse Query Acceleration or some non-Fabric query engine that's good at querying Delta (e.g. for local development, DuckDB works great).
That's pretty much it. Now all you have to do is code up whatever you feel like collecting in Step 3 and 4, and represent it in the OpenTelemetry Metric format.
A primer on Spark Plugins
The resource I studied to "grok" Spark Plugins was this amazing blog that talks about everything you can do with a Spark Plugin. If you read through the 5 blogs in their website, you'll have a clear understanding of what Spark Plugins can do (including initiating custom RPC communication between Executor <> Driver).
From there, you can fork and build these toy plugins locally as inspiration:
- Various examples from the blog - I'd recommend starting with the simple
CustomDriverPluginthat basically listens on a socket. - Next, check out some of the entertaining plugins a Spark Enthusiast at CERN - Luca Canali - maintains here. The
RunOsCommandPlugin.scalagot my creative juices flowing, because I realized you can literally do whatever you want (including runningbashscripts from Scala!)
Instrumenting Memory on a Linux JVM
In my case, what I decided to do was register with Spark's registerMetrics:
  /**
   * Register metrics published by the plugin with Spark's metrics system.
   * <p>
   * This method is called later in the initialization of the Spark application, after most
   * subsystems are up and the application ID is known. If there are metrics registered in
   * the registry ({@link PluginContext#metricRegistry()}), then a metrics source with the
   * plugin name will be created.
   * <p>
   * Note that even though the metric registry is still accessible after this method is called,
   * registering new metrics after this method is called may result in the metrics not being
   * available.
   *
   * @param appId The application ID from the cluster manager.
   * @param pluginContext Additional plugin-specific about the Spark application where the plugin
   *                      is running.
   */
  default void registerMetrics(String appId, PluginContext pluginContext) {}
Like this:
import org.apache.spark.api.plugin.{PluginContext, SparkPlugin}

object OpenTelemetryPlugin extends SparkPlugin {

  def registerMetrics(ctx: PluginContext): Unit = ctx.metricRegistry.registerAll(new OpenTelemetryMetricSet)

}
In Spark documentation's Advanced instrumentation it mentions Spark uses the Dropwizard metrics library - this is also obvious when you look at Spark source code.
Here, OpenTelemetryMetricSet is basically an implementation of MetricSet:
package your.plugin.opentelemetry.metrics

import java.util.HashMap

import com.codahale.metrics.{Metric, MetricSet}

/** Provides a complete set of metrics related to monitoring Spark via OpenTelemetry.
  */
class OpenTelemetryMetricSet extends MetricSet {

  /** Returns a map of metrics to be monitored.
    *
    * @return
    *   A map of metric names to their corresponding Metric objects.
    */
  override def getMetrics: HashMap[String, Metric] = {

    val metrics = new HashMap[String, Metric]

    // Use `metrics.put("your-key", new YourMetric)` to track anything as a Metric you want!

    metrics

  }
}
The final piece of the puzzle is specifying a sink config as part of this Sink trait, which is where Spark will call back your code periodically to Sink wherever you want (like an OpenTelemetry HTTP endpoint).
package your.plugin.opentelemetry.metrics

import java.util.Properties

import com.codahale.metrics.MetricRegistry
import your.plugin.opentelemetry.metrics.OpenTelemetryReporter

import org.apache.spark.metrics.sink.Sink

/** A custom implementation of the Spark Metrics [[Sink]] for OpenTelemetry usage.
  *
  * This class must be specified as part of in order to eagerly begin pushing
  * metrics.
  *
  *   - `spark.metrics.conf.*.sink.<sinkNameThatDoesNotHaveToExist>.class`
  *
  * @param property
  *   A [[Properties]] object containing configuration properties.
  * @param registry
  *   A [[MetricRegistry]] instance used to register and manage metrics.
  */
class OpenTelemetrySink(val property: Properties, val registry: MetricRegistry) extends Sink {

  private val reporter = new OpenTelemetryReporter(registry)
  override def start(): Unit = reporter.start()
  override def stop(): Unit = reporter.stop()
  override def report(): Unit = reporter.report()

}
Sending to OpenTelemetry
This step is implementation specific, which is where we need to take those Metrics and send it to OpenTelemetry. I won't go into the details here since it's not relevant for this discussion (it's a whole wonderful world of OpenTelemetry SDKs and Protobuf bindings).
Examining Heap Dump Data as a time-series with hprof-slurp
Remember how I said you can literally do anything you want in a Spark Plugin?
That includes taking a heap dump when your Executor is close to dying at 95% heap memory with jmap -dump to generate an hprof (heap allocation profile) file.
You can use mssparkutils to copy the dump into OneLake/ADLS etc, download it on your laptop, then use this awesome Rust based heap dump analyzer called hprof-slurp to analyze what's using up all your memory.
![This is what a JOIN explosion looks like, where you hold on to 31 GB of byte[] on the heap This is what a JOIN explosion looks like, where you hold on to 31 GB of byte[] on the heap](/static/d7b89ce51e63c60b75189a817c6b9b9c/8cd91/hprof-slurp.png)
What the collected data looks like
Running the plugin locally and logging to console, we see a glob of JSON, like this:

And as far as observability goes, this contains pretty much everything you'll ever dream of to monitor memory usage of anything running on a JVM - including Spark 🙂
{
   "durationNs":"3055428",
   "executorId":"driver",
   "hostname":"4fddd6c854cc",
   "jvm.buffer.direct.capacity":"16440",
   "jvm.buffer.direct.count":"10",
   "jvm.buffer.direct.used":"16441",
   "jvm.buffer.mapped.capacity":"0",
   "jvm.buffer.mapped.count":"0",
   "jvm.buffer.mapped.used":"0",
   "jvm.durationNs":"284900",
   "jvm.gc.PS-MarkSweep.count":"5",
   "jvm.gc.PS-MarkSweep.time":"276",
   "jvm.gc.PS-Scavenge.count":"8",
   "jvm.gc.PS-Scavenge.time":"94",
   "jvm.memory.heap.committed":"5391253504",
   "jvm.memory.heap.init":"2111832064",
   "jvm.memory.heap.max":"45813334016",
   "jvm.memory.heap.usage=0":"01330079037223502",
   "jvm.memory.heap.used":"609353552",
   "jvm.memory.non-heap.committed":"211353600",
   "jvm.memory.non-heap.init":"2555904",
   "jvm.memory.non-heap.max=":"1",
   "jvm.memory.non-heap.usage=-1":"72987552E8",
   "jvm.memory.non-heap.used":"172987552",
   "jvm.memory.pools.Code-Cache.committed":"42401792",
   "jvm.memory.pools.Code-Cache.init":"2555904",
   "jvm.memory.pools.Code-Cache.max":"251658240",
   "jvm.memory.pools.Code-Cache.usage=0":"16754302978515626",
   "jvm.memory.pools.Code-Cache.used":"42163584",
   "jvm.memory.pools.Metaspace.committed":"168951808",
   "jvm.memory.pools.Metaspace.init":"0",
   "jvm.memory.pools.Metaspace.max=":"1",
   "jvm.memory.pools.Metaspace.usage=0":"7743271264667377",
   "jvm.memory.pools.Metaspace.used":"130823968",
   "jvm.memory.pools.PS-Eden-Space.committed":"970457088",
   "jvm.memory.pools.PS-Eden-Space.init":"528482304",
   "jvm.memory.pools.PS-Eden-Space.max":"17074487296",
   "jvm.memory.pools.PS-Eden-Space.usage=0":"03196553211456382",
   "jvm.memory.pools.PS-Eden-Space.used":"545795072",
   "jvm.memory.pools.PS-Eden-Space.used-after-gc":"0",
   "jvm.memory.pools.PS-Old-Gen.committed":"4366794752",
   "jvm.memory.pools.PS-Old-Gen.init":"1408237568",
   "jvm.memory.pools.PS-Old-Gen.max":"34359738368",
   "jvm.memory.pools.PS-Old-Gen.usage=0":"0018497952260077",
   "jvm.memory.pools.PS-Old-Gen.used":"63558480",
   "jvm.memory.pools.PS-Old-Gen.used-after-gc":"63558480",
   "jvm.memory.pools.PS-Survivor-Space.committed":"54001664",
   "jvm.memory.pools.PS-Survivor-Space.init":"87556096",
   "jvm.memory.pools.PS-Survivor-Space.max":"54001664",
   "jvm.memory.pools.PS-Survivor-Space.usage=0":"0",
   "jvm.memory.pools.PS-Survivor-Space.used":"0",
   "jvm.memory.pools.PS-Survivor-Space.used-after-gc":"0",
   "jvm.memory.total.committed":"5602607104",
   "jvm.memory.total.init":"2114387968",
   "jvm.memory.total.max":"45813334015",
   "jvm.memory.total.used":"782341104",
   "jvm.threadCount":"144",
   "jvm.uptimeMs":"78841",
   "mallinfo.allocated":"91398960",
   "mallinfo.durationNs":"2013029",
   "mallinfo.free":"145513680",
   "mallinfo.releasable":"3536",
   "procfs.durationNs":"673535",
   "procfs.meminfo.Buffers":"447967232",
   "procfs.meminfo.Cached":"20393086976",
   "procfs.meminfo.MemAvailable":"123014176768",
   "procfs.meminfo.MemFree":"102403887104",
   "procfs.stat.threads":"186",
   "procfs.stat.vmRss":"1488056320",
   "procfs.subprocess.count":"0",
   "procfs.subprocess.countWithoutStat":"0",
   "procfs.subprocess.totalRss":"0",
   "spark.durationNs":"18235",
   "spark.offHeapExecutionMemoryUsed":"0",
   "spark.offHeapStorageMemoryUsed":"0",
   "spark.onHeapExecutionMemoryUsed":"0",
   "spark.onHeapStorageMemoryUsed":"240187",
   "timestamp=2025-05-12 15:15:37":"36"
}
Power BI Real-time Report
And finally, for the crème de la crème, we have a little "Data Dictionary" for the Metrics above (there's so much being tracked, I forgot what I was tracking):
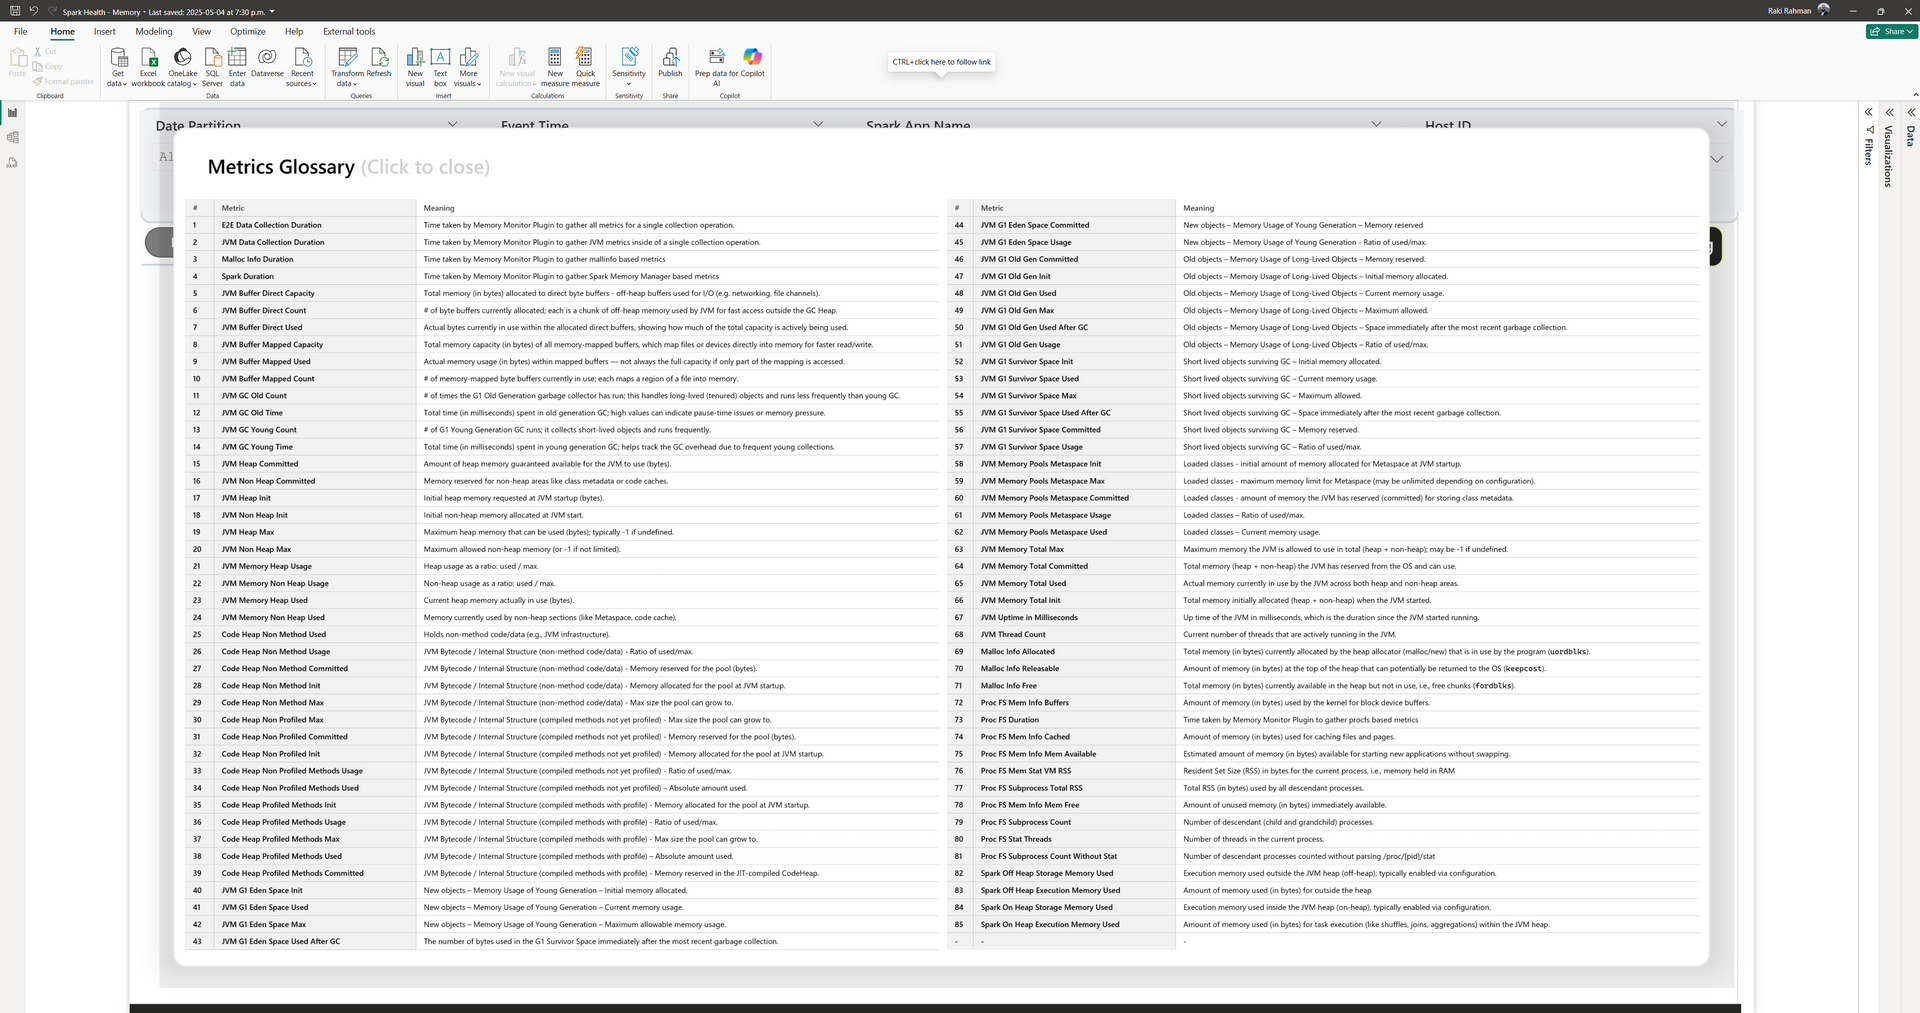
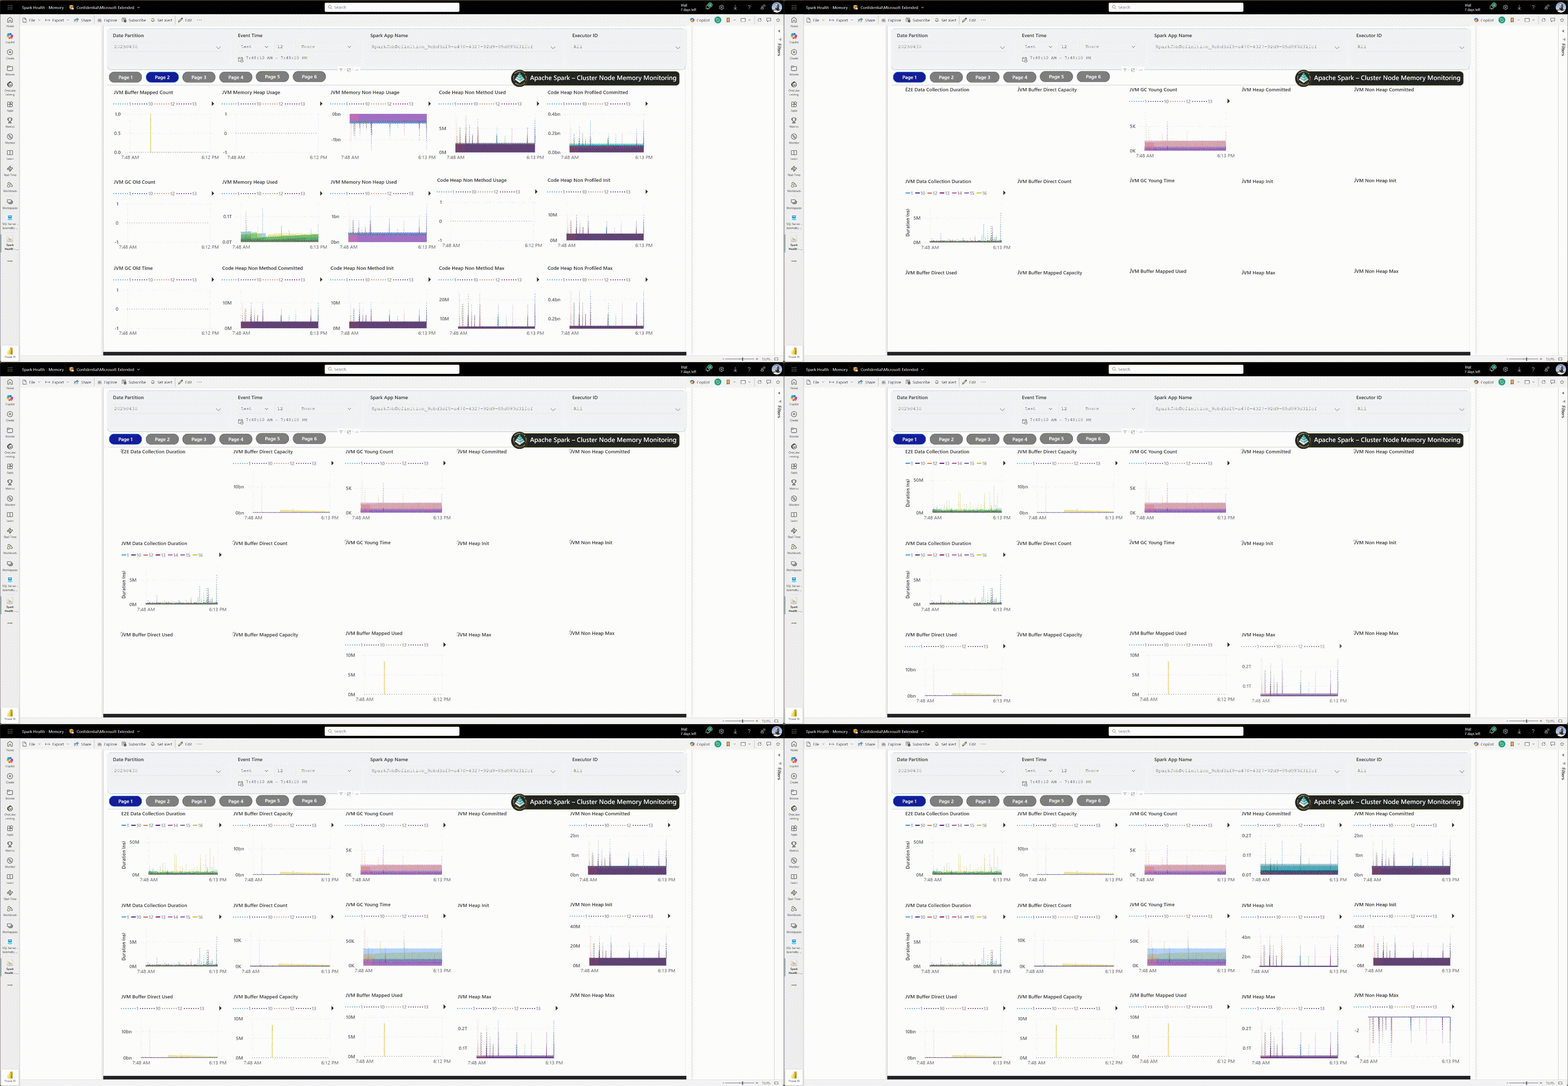
And the real-time report:
In particular, this is what the JOIN key explosion looks like:
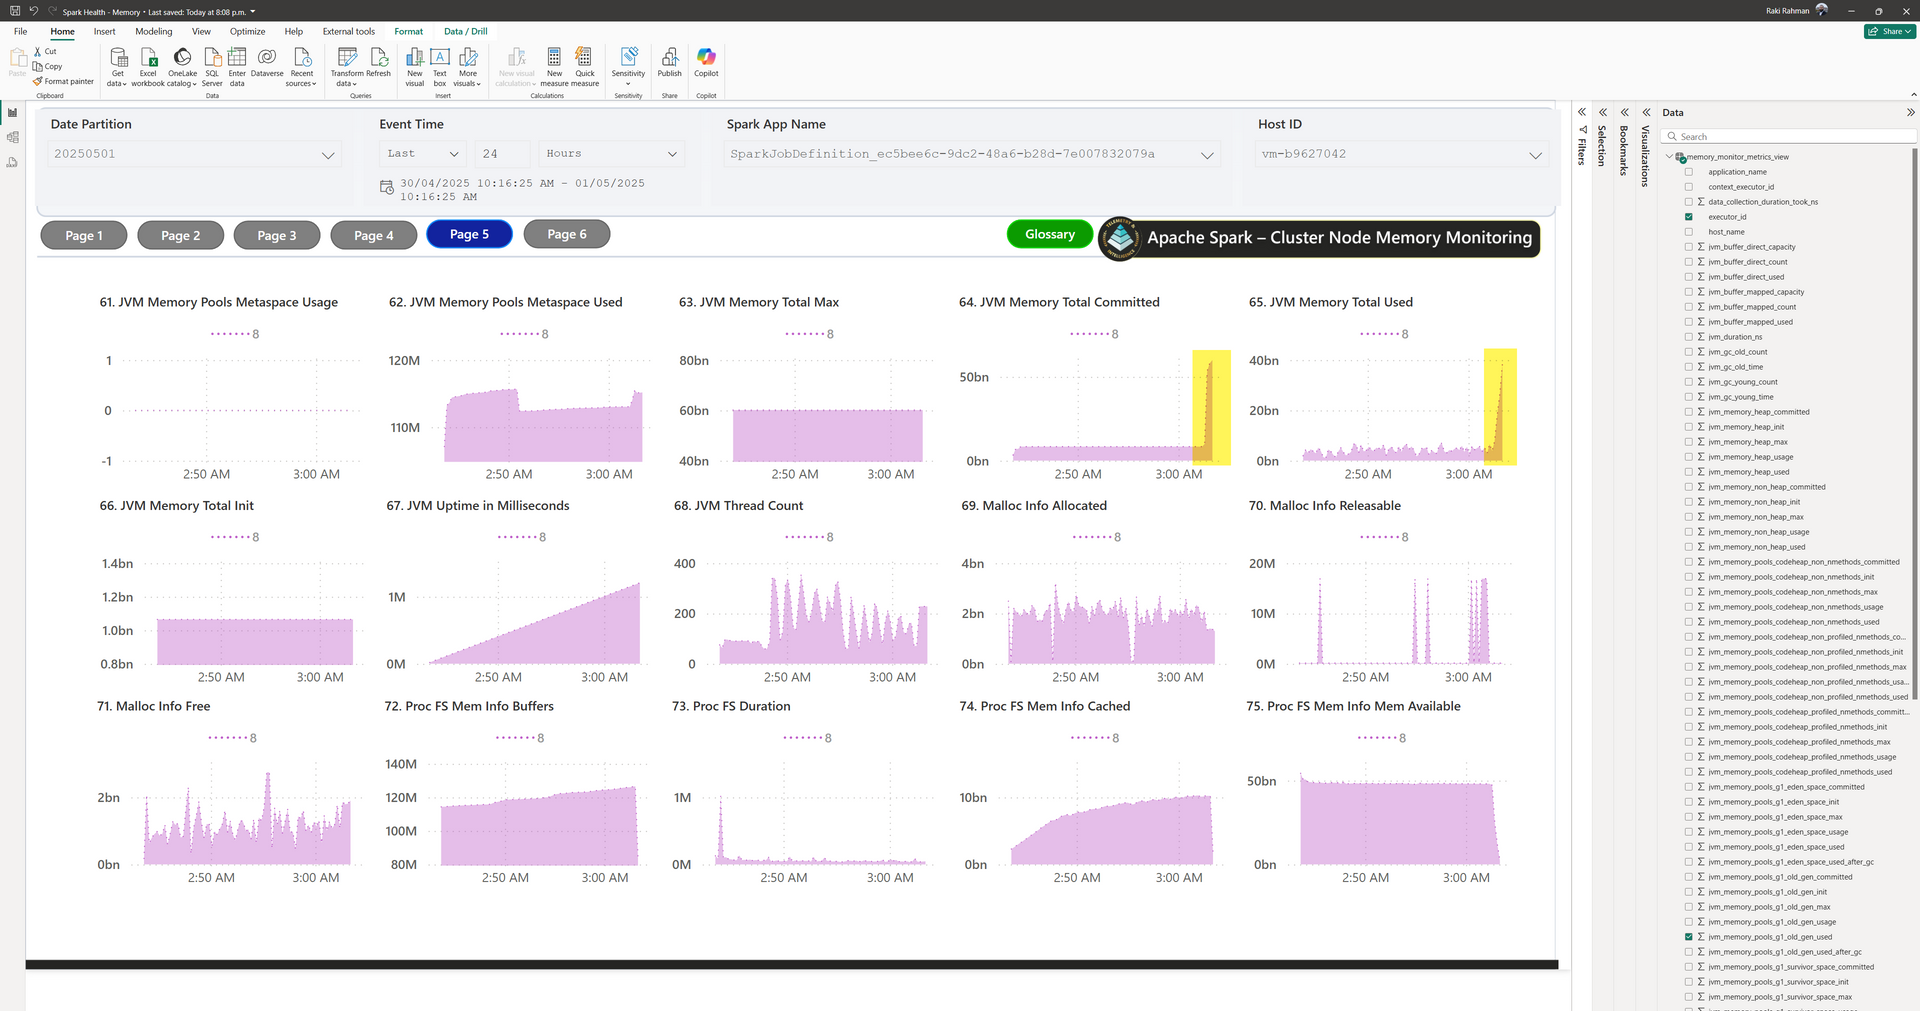
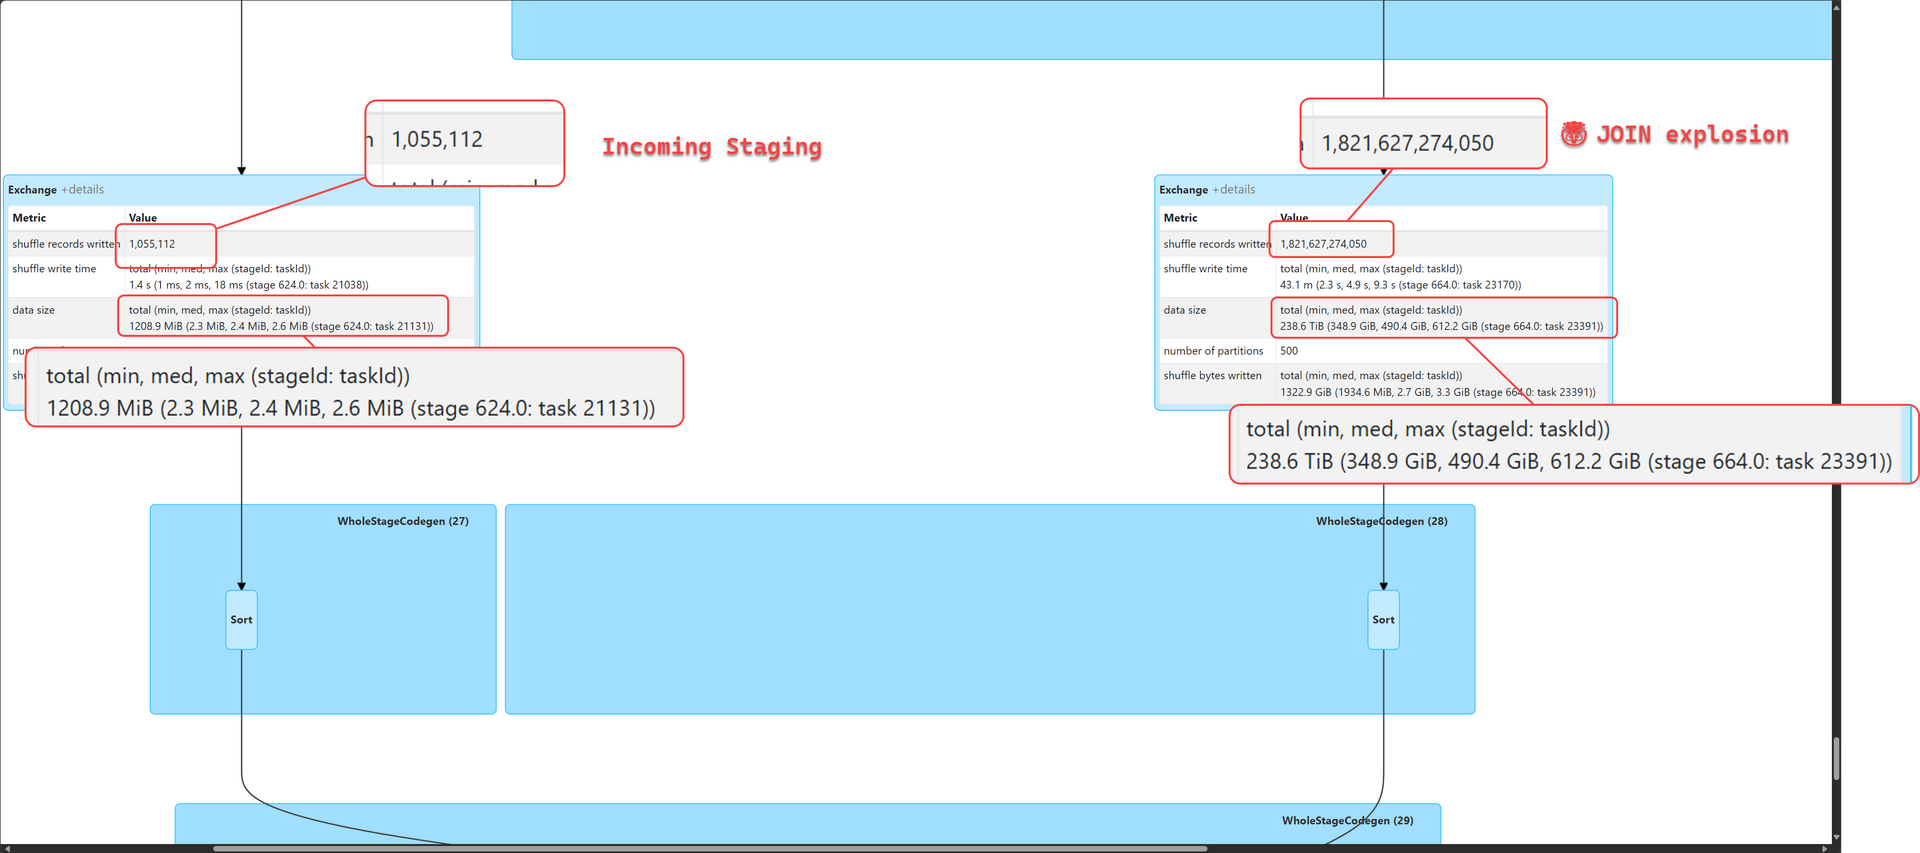
The moment I saw that spike, I realized this cannot be a memory leak (leaks happen gradually when someone forgot to return the memory to malloc - that's not what's happening here), but rather, something to do with my actual data sizes at a particular Stage of the Spark Job.
Conclusion
Looking at the query plan at around the time the memory exploded, I saw this craziness:
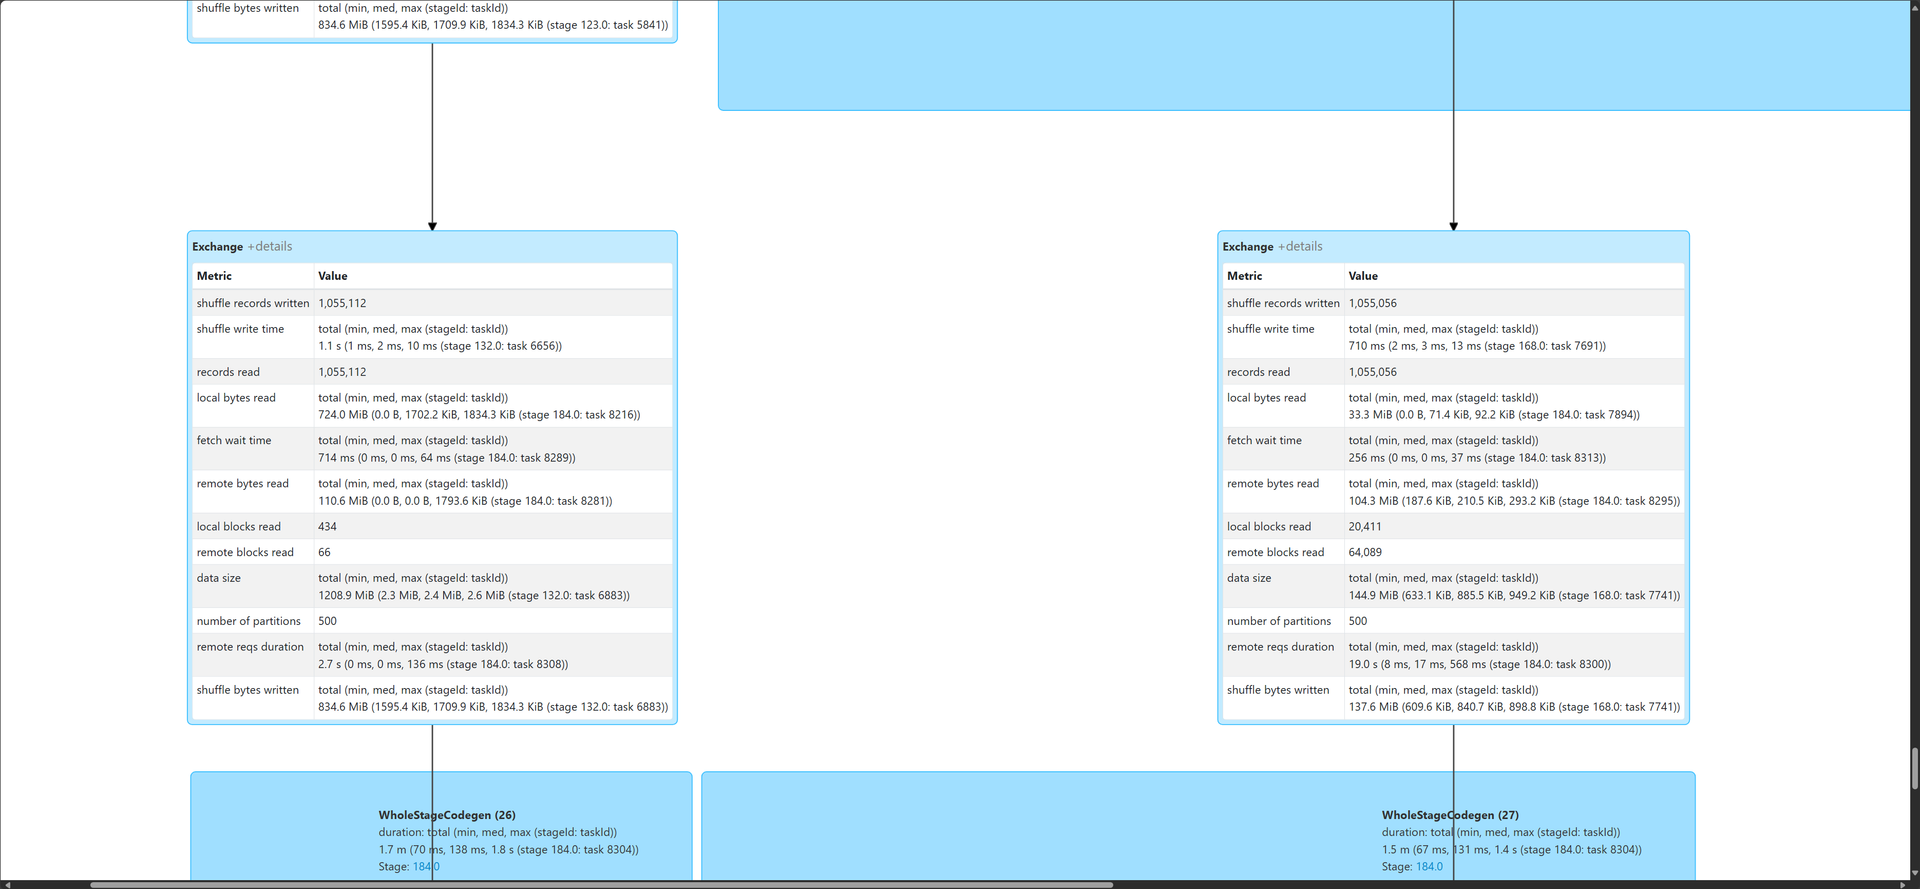
After finding the part of the code that corresponded to this Stage, I switched to LEFT SEMI JOIN in a tiny change, and all my problems went away:
I'll never have to be worried about ERROR 137/143 in Spark again - which if you've used Spark in production, is the most (and probably only) painful error - thanks to this OpenTelemetry plugin.
Observability for the win!